CrossTabs are used for creating statistical view of a large sample data.
They allow you to summarize a huge unorganized data to be organized in terms of commons between the data.
Suppose You have a data containing two columns Year, Brand of the car sold
Some thing like this

Now if you have to tell the total sales of Audi in 2000,2001,2002. It will be a long and tedious process, so to show it Schematically We can have Distinct Years and Distinct Car Brand Names for representing the data as they are the are the common attribute to the data .
So the statistical data will look like this

In the table above you could easily determine the Number of car sold for either of the brands and in which specific year. Also The last column where the the two totals converge i.e. 16 shows you the total value of the sample.
Now let me quickly move on to implementation of Cross Tab in Jasper Reports rather iReport.
For the tutorial I would be using the iReport v5.6.0
1. The data needs to be retrieved from a datasource (either JDBC/JavaBeans/Custom Datasource/Excel/CSV... etc)
2. For the demonstration purposes I will be using the Excel File as the datasource.
3. After defining the datasource, we need to add the CrossTab element from the pallete.
4. Pallete could be accessed, Window( Menu Bar) --> Pallete, then from there the CrossTab could be found under the Report Elements.
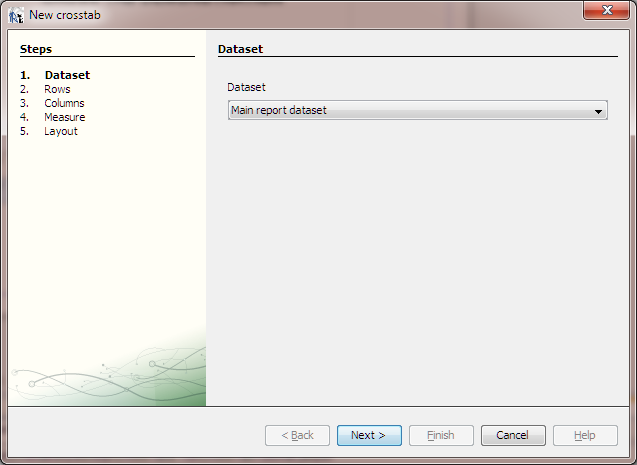
5. As soon as we drag the Pallete, we get an wizard as below,
- Select the datasource, if subdataset is created then we can use that or simply the main dataset could be used. For the tutorial Main dataset is used
- Next will appear the grouping criteria for the rows which in short means that which field(s) will come on the Rows of the Cross Tab. We need the car companies on as the rows which are unique.

- Next will appear the grouping criteria for the Columns which in short means that which field(s) will come on the Columns of the Cross Tab. We need the Years on as the rows which are unique

- Next will be the Measure or the count of the value in particular grid.
Which in our case would be the number of cars of a particular company in a particular Year
- Then will come the window to select the layout of the crosstab, this means here we can customize the looks of the cross tab by defining the colors and which columns to show/hide.

6. Now this brings to the completion of the crosstab, now we could see that a tab at the bottom left corner appeared showing the name of the Crosstab, as Crosstab 1. There we could see the columns and design of the Crosstab.
7. Now a very critical point is placement of the crosstab, this should be really placed in a report band wherein the data is calculated already and then is to be shown in crosstab, the most favorable band to show the CrossTab is Summary band, else it will throw an Error Incrementing crosstab dataset/ Crosstab already been processed.
Now to Explain the exceptionWhat "Crosstab data has already been processed" exception means?This exception is thrown if more data is added to the crosstab dataset after the crosstab has already been rendered.
This usually happens when a crosstab element is linked to the main dataset of the report (does not use a subdataset run) and the resetType attribute of the crosstab dataset does not match the place where the crosstab is rendered.
Crosstabs are special components that display aggregated data. And when they are linked to the main dataset of the report, you simply cannot put them in the detail section, because there is no data to aggregate from a single record.
Such crosstabs could only reside on a group footer or on the summary section of the report and have the appropriate resetType value, so that their dataset is initialized each time after they are rendered.
If you still think you need to render one crosstab for each detail in the master document, then almost certainly this crosstab should be linked to a subdataset and not to the main dataset of the report.
How to set up the tutorial Report:
1. Unzip the file downloaded from the above link.
2. The Zip contains sampleds.xls, CrossTabTut.jrxml and TestRun.pdf
3. Open iReport and set up the Excel Datasource using the sampleds.xls
3. Open iReport and set up the Excel Datasource using the sampleds.xls
4. Then open the sample report and its ready to run.
Hope that this helps!!
Cheers!!
Cheers!!
I cannot see Image 1 and Image 2. Can you update this?
ReplyDeleteThanks
Please check now, I have reinserted the images.
DeleteThanks.
images not found
ReplyDeleteCan you please tell me which images are not visible?
DeletePlease check now, I have reinserted the images.
ReplyDeleteThanks.
when I downloaded and tried this, I got o/p preview as null.. Any idea ?
ReplyDeleteThank you that was helpful
ReplyDeleteHow to add crosstab footer in existing crosstab in report.
ReplyDelete