Translate

Friday, 21 November 2014

Jasper Report- JRException: Image read failed

 This Exception comes generally when you try to export the report on Jasper Server in PDF Format, or from iReport, then due to the error in some of the image or all the images, which is producing the error.

So to overcome this issue, you could set following properties of the image:

1. Firstly you could simply setting the Cache Property to true
2. If that does not resolves the issue then you can set the property Error type to Blank


Hope that this helps.

Cheers!!


Monday, 3 November 2014

Jasper Reports Server's unique Source Code Management System


Jasper Reports Server is basically a stand alone as well as embedded  reporting server which can be easily used for deploying the Jasper Reports. It provides a way to embed reports as well as analytics into a web or mobile application, as well as act a informational hub.

Server is made to securely share and manage the Jasper reports and analytic views. The security feature is implemented via role management and user creation facility in Jasper Server.

Now there are two ways you can use Jasper Server
1. Standalone application
2. Embed into services, or applications.

Now moving on to the Source Code Management,


    What benefits do Source Code Management tools provide?

SCM tools help development teams in many ways:
  • Collaboration: SCM tools prevent one user from accidentally overwriting the changes of another, allowing many developers to work on the same code without stepping one each other's toes.
  • History: SCM tools track the complete development history of the software, including the exact changes which have occurred between releases and who made those changes.
  • Release notes generation: Given the tracking of each change, the SCM can be used to generate notes for their software releases which accurately capture all of the changes included in the new release.
  • Documentation and test management: SCM tools can be used to manage not just software source code, but also test suites and documentation for their software.
  • Change notifications: To keep interested members of the team informed when changes occur to the source code.

   Who uses SCM tools?

SCM tools are used by:
  • Project developers who are writing source code.
  • Project testers who need to download the very latest changes.
  • Advanced users who want to try out code that is not yet stable, mature or released.

In JasperServer, the SCM is managed very intelligently, whenever you draw a report for viewing in then you always get a version of the report, so you are not really modifying what is there on server. 

Jasper Server always keeps the original content on the server and provides the user with an instance of the report which is directly stored in the Temp folder, and if you need the modified version you have created as the current version then you need to replace the report with the current version of the report, by right clicking on the report in the repository and then replacing the report.

In light of this feature there is also a extreme care to be taken that which version is being replaced, because if once replaced the version of the report will be changes and it would be not possible to roll back the change.

This feature is really very great when you need to work on the small modification in the report as you can draw a copy on the local system and work onto that until you get the desired modification as well as you can simultaneously compare the previous version of the report and if you get the desired changes executed you can replace the report and have a new version of the report.

Hope this information helps you a lot!!
Cheers!!

Tuesday, 16 September 2014

Getting to know CrossTabs and how to implement in Jasper Reports


CrossTabs are used for creating statistical view of a large sample data.

They allow you to summarize a huge unorganized data to be organized in terms of commons between the data.

Suppose You have a data containing two columns Year, Brand of the car sold

Some thing like this 


Now if you have to tell the total sales of Audi  in 2000,2001,2002. It will be a long and tedious process, so to show it Schematically We can have Distinct Years and Distinct Car Brand Names for representing the data as they are the are the common attribute to the data .

So the statistical data will look like this


In the table above you could easily determine the Number of car sold for either of the brands and in which specific year. Also The last column where the the two totals converge i.e. 16 shows you the total value of the sample. 

Now let me quickly move on to implementation of Cross Tab in Jasper Reports rather iReport.
For the tutorial I would be using the iReport v5.6.0


1. The data needs to be retrieved from a datasource (either JDBC/JavaBeans/Custom Datasource/Excel/CSV... etc)
2. For the demonstration purposes I will be using the Excel File as the datasource.
3. After defining the datasource, we need to add the CrossTab element from the pallete.
4. Pallete could be accessed, Window( Menu Bar) --> Pallete, then from there the CrossTab could be found under the Report Elements.
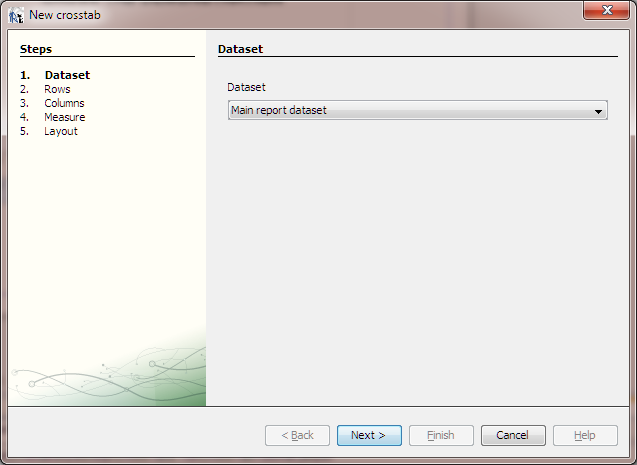
5. As soon as we drag the Pallete, we get an wizard as below,


  •     Select the datasource, if subdataset is created then we can use that or simply the main dataset could be used. For the tutorial Main dataset is used
  • Next will appear the grouping criteria for the rows which in short means that which field(s) will come on the Rows of the Cross Tab. We need the car companies on as the rows which are unique.

  • Next will appear the grouping criteria for the Columns which in short means that which field(s) will come on the Columns  of the Cross Tab. We need the Years on as the rows which are unique
  • Next will be the Measure or the count of the value in particular grid.
    Which in our case would be the number of cars of a particular company in a particular Year

  • Then will come the window to select the layout of the crosstab, this means here we can customize the looks of the cross tab by defining the colors and which columns to show/hide.


    6. Now this brings to the completion of the crosstab, now we could see that a tab at the bottom left corner appeared showing the name of the Crosstab, as Crosstab 1. There we could see the columns and design of the Crosstab.


    7. Now a very critical point is placement of the crosstab, this should be really placed in a report band wherein the data is calculated already and then is to be shown in crosstab, the most favorable band to show the CrossTab is Summary band, else it will throw an Error Incrementing crosstab dataset/ Crosstab already been processed.

    Now to Explain the exception
    What "Crosstab data has already been processed" exception means?
    This exception is thrown if more data is added to the crosstab dataset after the crosstab has already been rendered.
    This usually happens when a crosstab element is linked to the main dataset of the report (does not use a subdataset run) and the resetType attribute of the crosstab dataset does not match the place where the crosstab is rendered.
    Crosstabs are special components that display aggregated data. And when they are linked to the main dataset of the report, you simply cannot put them in the detail section, because there is no data to aggregate from a single record.
    Such crosstabs could only reside on a group footer or on the summary section of the report and have the appropriate resetType value, so that their dataset is initialized each time after they are rendered.
    If you still think you need to render one crosstab for each detail in the master document, then almost certainly this crosstab should be linked to a subdataset and not to the main dataset of the report.


How to set up the tutorial Report:

1. Unzip the file downloaded from the above link.
2. The Zip contains sampleds.xls, CrossTabTut.jrxml and TestRun.pdf
3. Open iReport and set up the Excel Datasource using the sampleds.xls
4. Then open the sample report and its ready to run.


Hope that this helps!!
Cheers!!


Thursday, 24 July 2014

Jasper Reporting Tutorial Playlist.

Here is the playlist which I have compiled including all my tutorials on youtube
Cheers!!


Monday, 24 March 2014

Using Styles in Jasper Reports

We have been accustomed to use style sheets or CSS in our HTML codes, parallel to that we can use Styles in Jasper Reports also. It provides same utilities like conditional, non -conditional and could be applied on  any element in the Report.

Now how to create styles, there are two methods basically:
1. External Style Sheet (jrtx file)
2. Declaring Internal Styles in the report itself.

The advantages of using external Style sheet is that it provides modularity and re-usability of the style over large number of reports using similar kind of styles. On the other hand, Internal styles would only contains the styles definitions for a particular report.

How to apply styles in the reports(iReport).

1. Locate the Styles node in the Report Inspector.
2. Right Click on the node and add a new Style
3. Then you could define the properties of the Style in the in the properties pane. Properties like background-color,forecolor, outline,.. etc/
4. You could even click on the Style and add a conditional Style and define conditional styles, like alternate coloring and much more.
5. After defining the styles now in the application part, locate the element onto which you want to apply the style.
6. Select the particular style in the property called Style(could be found in the properties pane) of the Element.

I have created a simple tutorial video demonstrating the Styles in Jasper Reports. Click Here

Download the sample demonstrated in the video tutorial from here. The ZIP file contains :
1. The JRXML File
2. The jrtx Style.

The Sample uses the Sample database so no need to worry about the datasource.

Happy Coding.

How to display the Username of the user who logged into JasperServer

Many a times we require the name of the person who logged into the Jasper Server and according to this information we are able to show/hide the elements on report, or simpley to log the user name we can use it.

So how to achieve this ? 


We can create parameters in our report, with a specific name and datatype. Then these parameters will be automatically filled when the report is executed by JasperReports Server.
LoggedInUsername (java.lang.String), with no default value. Then, we can use $P{LoggedInUsername} in a text field, in a query, in a printWhenExpression, etc ...
This is a built in parameter which gets filled with the User Details when report is run on Jasper Server.
Note that the report if run in iReport, would get a null value. So for the correct results it is necessary that we deploy the report onto JasperServer.


Parameter Name
Type
Notes
LoggedInUser
User
Not usable in query input control,
 but is used as parameter to report
LoggedInUsername
String
Of logged in user
LoggedInUserFullName
String
Of logged in user
LoggedInUserEmailAddress
String
Of logged in user
LoggedInUserEnabled
Boolean
Is logged in user enabled?
LoggedInUserExternallyDefined
Boolean
Is logged in user externally defined?
 ie. authenticated externally
LoggedInUserTenantId
String
Of logged in user. Only relevant in 
Pro/Enterprise.
LoggedInUserRoles
Collection<string>
Current set of roles of logged in user. 
Useful for $X parameter
LoggedInUserAttributes
Map<string, string>
Not usable in query input control, but is 
used as parameter to report.
 Empty map if no attributes
LoggedInUserAttributeNames
Collection<string>
User profile attribute names. Useful for
 $X parameters. Empty collection if no
 
attributes
LoggedInUserAttributeValues
Collection
-
LoggedInUserAttribute_<attribute name>
String
Attribute value for matched attribute name (like "att1") on the user. Empty string if no match. Only provided if defined in a query or as a report parameter.

Using the above parameters we could easily get various important information which could help in defining the roles. 

Happy Coding.!!

Thursday, 6 March 2014

Cascading Parameters in Jasper Reports

Cascading, what does one mean by saying cascading, literally it means anything that resembles a waterfall or especially seeming to flow. Now where to implement this in Jasper Reports?    

Right, it could be used in parameters, or rather the filters which are dependent on each other. You can find these kind of filters in online shopping websites, wherein we can choose on various filters like if we want to buy the laptop first filter would be Laptop next filter would be the company chosen among the companies which sell Laptops, and then we chose for the specifications like processor,ram etc. each have separate filters but the boundaries of the parameter depends on the previous parameter.

Before getting into the setup of Cascading Parameters in Jasper Report there are few things which we need to know before hand - 
Usage of     $X{IN, feild, parameter} in the SQL Query used in the Where clause, which filters the data based on the selection. Let me go one by one in explaining the components
field - Now this is the field in the database upon which the find will be done
parameter - Now this is the parameter selected by user and will be queried or looked in the field. This enable for multi select also in the parameters.

Now in  order to achieve this in Jasper Reports we need to follow few steps.

  1. First of all you need to design a Jasper Report and identify the parameters to be cascaded
  2. Then we need to define the expression for parameters,  and mind one thing that each of the parameter need to be of type java.util.collection if you want to enable multi- select.
  3. Next and very important thing is that the cascading parameters could not be tested in iReport / JasperSoft Studio, this  needs to be deployed on Jasper Server in order to check the correct functionality. Though could be run in iReport or JasperReports with default values hardcoded.


I have created a working sample which could be simply deployed, and checked for the functionality and working.
The Zip file could be downloaded from here  - LINK TO ZIP FILE

The Zip file contains
1. Cascade Parameter Report (JRXML File)
2. SQL DUMP, could be extracted using MySQL or any other tool
3. Table Creation Script in a notepad file, this will allow you to create the require table in the database.

For setting up the sample report you need to-
1. Create a schema in you database and create the table using the script command
2. Then run the JRXML file using iReport/Jaspersoft Studio
3. Then set the datasource referring to Persons table in the database.
4. Then deploy the JRXML  on the Jasper Server, and set the datasource and input controls. Do remember the names of the parameters used in the report should exactly match the input controls declared on the Jasper Server.

If you miss on some step then you could follow a YouTube video of mine which  will serve as a tutorial.
Below is the video where in you could see all the steps.


Please put your views or questions or suggestions below, I will be more than happy to hear them.Happy Coding!!